Creating a graph of images in Diagram Codes Studio
With the recent update (version 1.0.26) it's possible to include local images
in your diagrams.
In this example we create a graph. Each graph node has a bit of markdown to
display an image.
The images are located in the same folder as the .diagram file.
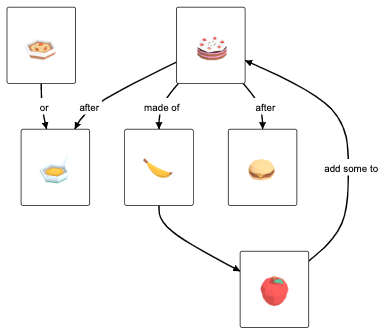
cake->bowl["after"]
cake->banana["made of"]
soup->bowl["or"]
apple->cake["add some to"]
cake->burger["after"]
banana->apple
MD"" as cake
MD"" as banana
MD"" as soup
MD"" as burger
MD"" as bowl
MD"" as apple